

The Hurricanes
At the end of September, 2025, a rare weather phenomenon occurred in the western Atlantic. Two hurricanes, Humberto and Imelda, formed and began marching to the east coast of the United States. Humberto interacted with Imelda, pulling it sharply east, away from the United States. This interaction is known as the Fujiwhara effect, which is more common in the Pacific Ocean than the Atlantic.
We pulled weather forecasts from September 24 and September 29 using our SkySparq Weather App, a native app on the Snowflake Marketplace. The app ingests GFS forecasts generated by the National Oceanic and Atmospheric Administration (NOAA) right into Snowflake for easy blending with your operational data.
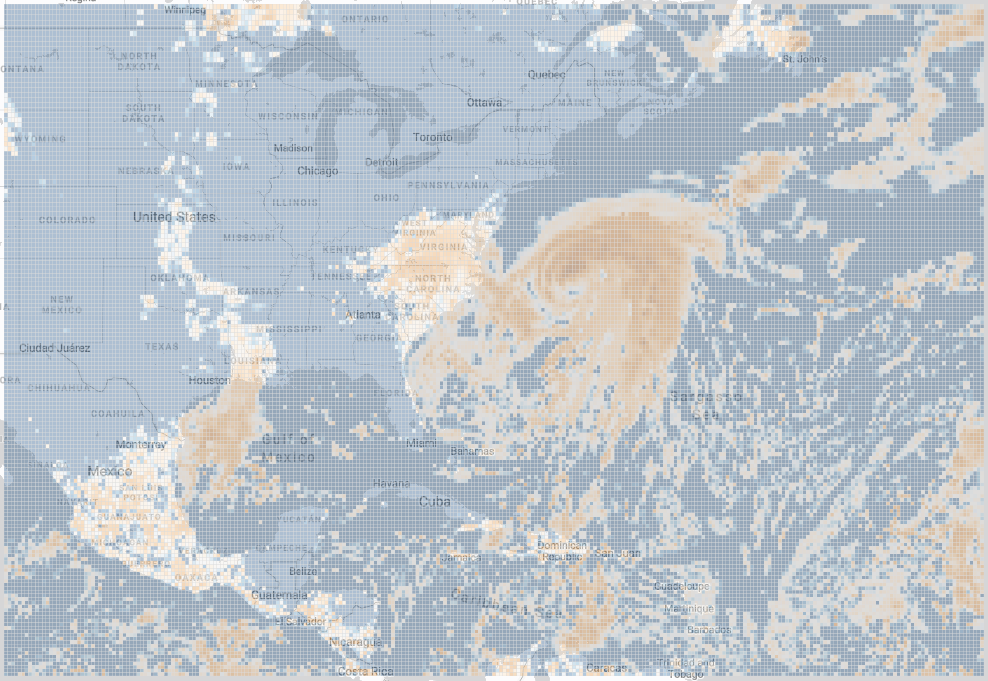
Weather data makes beautiful visualizations. We hooked up Sigma to our ingested forecasts and invite you to explore the forecasts for Humberto and Imelda.
The Visuals
Here are a few things you can explore for yourself:
- The default view is a forecast of Atmospheric Reflectivity for September 30 at 18:00 UTC (all times are in UTC). The Atmospheric Reflectivity forecast is similar to what you would see from NEXRAD weather radar, but at courser resolution. The view shows the strong eyewall structure of Humberto and its spiral rainbands. Imelda’s lesser-defined eye and bands are to the southwest.
- Change the Measurement to ISOBARICINHPA_500_HGT. This measurement equates to atmospheric pressure at 500mb, or approximately 18,000ft, and is used by meteorologists to identify large-scale weather patterns. You can see Humberto’s low pressure system hanging off the coasts of Virginia and North Carolina. Now, change the Cycle Time to the forecast generated at 2025-09-29 18:00:00. You can see how the forecasted positions and strengths of the two hurricanes has changed. Humberto’s low pressure system is weaker and slightly further south while Imelda’s low pressure system is stronger. Even the best forecasts lose accuracy more than 2 days into the future. Yet, even the longer forecasts still provide directionally-accurate data that can be used to assess magnitude of future weather events and provide early-warning information.
- Change the Measurement to WIND_GUST, which is the maximum predicted gust speed in km/h. We can see where strong gusts are expected and forecast possible wind damage. Now set the measurement to SURFACE_0_APCP_ACCUM. This identifies accumulated precipitation over the last 3 hours and can be used to predict potential flooding.
- Choose any variable you like and increment the Forecast Time day-by-day. You can see how the weather patterns are forecasted to evolve. If you go back to the 2025-09-24 18:00:00 forecast, you can see how Humberto and Imelda formed, grew, and interacted. The visualization provides a frame-by-frame view of the evolution of the unique interactions between these two powerful storms.
These are just 2 forecasts and 11 hand-picked measurements from GFS forecasts. Each GFS forecast contains over 700 measurements out to 384 hours (16 days) from the cycle time. GFS forecasts are generated 4 times per day. There is a wealth of weather data available to enrich your analysis with.
With the gridded format that GFS uses, it is easy to geofence areas of interest and aggregate expected conditions for those areas. You are not limited to postal-code areas or other artificial boundaries. And conditions are forecasted every 1 or 3 hours, so you can choose what parts of the day you want to collect or aggregate. This gives the analytic practitioner powerful levers to select the right weather data for their analysis. And the SkySparq weather app makes it easy to ingest this data right into Snowflake, where your other data already lies.
Interested in ingesting weather data? Try out the SkySparq Weather App for free on Snowflake Marketplace. Want to chat? Reach out and let’s have a conversation about how weather can be a meaningful input into your analysis.